
The Current Employment Crisis Has Deep Roots, Going Back Half a Century
Econintersect: The Associated Press (AP) has reported survey data indicating that approximately 80% of U.S. adults face severe economic struggles. The results show the hardship is rising particularly rapidly among whites. The poll was conducted by GfK Roper Public Affairs & Corporate Communications, a division of GfK Custom Research North America and was sponsored by the AP.

An AP article by Hope Yen says that the data “points to an increasingly globalized U.S. economy, the widening gap between rich and poor and loss of good-paying manufacturing jobs“.
More from the AP article:
While racial and ethnic minorities are more likely to live in poverty, race disparities in the poverty rate have narrowed substantially since the 1970s, census data show. Economic insecurity among whites also is more pervasive than is shown in government data, engulfing more than 76 percent of white adults by the time they turn 60, according to a new economic gauge being published next year by the Oxford University Press.
The gauge defines “economic insecurity” as a year or more of periodic joblessness, reliance on government aid such as food stamps or income below 150 percent of the poverty line. Measured across all races, the risk of economic insecurity rises to 79 percent.
The survey results are worse than the official statistics regarding poverty because the official statistics capture a “temporary snapshot” and miss the significantly larger number that cycle in and out of poverty and near poverty. The AP reports that, while 12.6% of adults age 25-60 lived in poverty in 2011, 40% of that cohort would spend at least a year of their lives in poverty.
The AR article discusses the increasing probability of encountering poverty in recent years:
The risks of poverty also have been increasing in recent decades, particularly among people ages 35-55, coinciding with widening income inequality. For instance, people ages 35-45 had a 17 percent risk of encountering poverty during the 1969-1989 time period; that risk increased to 23 percent during the 1989-2009 period. For those ages 45-55, the risk of poverty jumped from 11.8 percent to 17.7 percent.
By race, nonwhites still have a higher risk of being economically insecure, at 90 percent. But compared with the official poverty rate, some of the biggest jumps under the newer measure are among whites, with more than 76 percent enduring periods of joblessness, life on welfare or near-poverty.
Based on current trends, around 85% of all working-age adults in the U.S. will see periods of economic insecurity by 2030, according to the AP.
The current situation should not come as a surprise. It is a surprise only to the extent that we were not paying attention. The current data, with some added recent impacts from the Great Recession(GR), is resulting from long-term trends.
Divergence of the Median from the Mean
Since the 1970s U.S. household incomes have been diverging from parallel paths, with the average (mean) rising faster than the median (50% point). Such behavior is symptomatic of a “fattening tail” at high incomes.
Click on graph for larger image.

The decreasing ratio of median/mean household incomes shows a persistent and almost constant decline of 0.0018 per year, from 0.74 in 1974 to 0.67 in 2011. Another measure of income inequality, the GINI coefficient, has an even greater slope, from 0.395 in 1974 to 0.477 in 2011, for a change of 0.0022 per year.
Expressed as percentage change, the slope of the median/mean ratio is -0.24% per year and the GINI coefficient slope is +0.56% per year. Over the 38 year period the ratio has degraded by 9% and the GINI coefficient by 20%. As seen in a later graph virtually all of the change in GINI for the U.S. has occurred since 1981. From 1947 to 1980 GINI was essentially flat.
Women Wage Earners
 The demographics of the work force has been changing as well, along with the income distribution by gender. In another AP article Hope Yen reported that there has been a significant change in women as top earners in households over the past 50 years. By 2011 more than 20% of two earner households had the wife as the top earner. When single moms are included, more than 40% of all households with children are supported by women as the top earners.
The factors driving the increasing role of women as breadwinners has several driving factors. According to Yen, “the trend is being driven mostly by long-term demographic changes, including higher rates of education and labor force participation dating back to the 1960s women’s movement. Today, more women than men hold bachelor’s degrees, and they make up nearly half — 47 percent — of the American workforce.”
She also attributes recent factors to be the big losses in construction and manufacturing jobs dominated by men as a result of the GR, and the decline in marriage rates with the concomitant rise in births out of wedlock resulting in single mother households increasing in number.
A Pew Research poll result released in May traced the deeper history of women as breadwinners.

Gender Disparity
Yet, in spite of the increased number of households depending on women to “bring home the bacon”, women’s pay still lags that of men. Women have been gaining ground. After the ratio of median incomes for women vs. men declined following the end of World War II into the 1960s, it has been rising since. However it was not until 1989 that the ratio returned to the level of 1947.
Click on graph for larger image.

A commonly observed economic factor is the failure of real household income to increase in the U.S. over the past 20+ years and to have in fact declined since 2000. (See GEI News.)
In a 2011 article the history of the economy for wage earners was discussed and the following graph was shown:
Click on graph for larger image.

In 2011 we confessed to not having a clear understanding of what produced the “golden years”. Referring to the graph above (Median Income by Gender (1947-2011) we can now see that it was entirely due to the rapid increase in women in the work force and the steepest rise in relative pay for women, both occurring from the late 1970s to the mid-1990s that is the primary “golden” factor. Men were a non-factor in the standard of living improvement during the golden years. Real income for men has been essentially unchanged for half a century.
The U.S. in the World
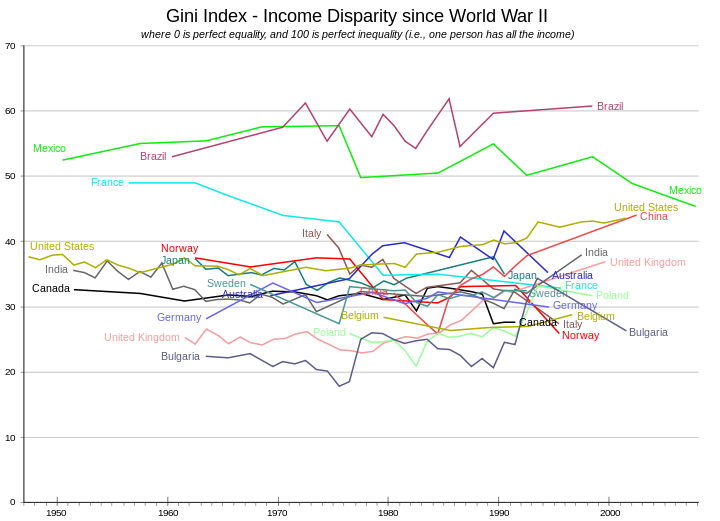
Since the second world war the United States has not had “good” income distribution compared to much of the world. But since 1980 the distribution of income has degraded on a relative scale so the the U.S. is now in an “exclusive” group of three with China and Mexico, and has the dubious distinction of being second only to Brazil in income inequality.
Click on graph for larger image at Wikipedia.
In a 2011 working paper the problems of variation of return to capital and return to labor were analyzed. At that time the start of the decline in return of economic gains to labor were identified as occurring about 1980 by one measure and around 1990 by another.
We can now see that the stage was set long before those dates when the real median income for men stopped increasing in the mid-1960s and remained at those levels for nearly 50 years.
How Moms Compensated
The standard of living of families continued to advance through the “Golden Years” because more Moms were working and they were earning an increasing portion of what men were earning. So real household income advanced, although with some volatility due to changes throughout the business cycle, until the peak was reached in 2000. But the demographic shift in the workforce was starting to play out by the early 1990s.

The trend of women coming increasingly into the workforce was ending in the 1990s. But the negative impact on household income growth was masked by the internet revolution and the dot.com bubble, which kept employment high. Once the business cycle reared its ugly head with two 21st century recessions, the impact of the end of the 1960s to 1990s “feminization of the workforce” was felt full force. It was only made more stressful by the declines in male employment as result of the Great Recession.
So Dad stopped growth of real median income some 45+ years ago. Mom stepped into the breach and compensated to keep family prosperity growing. But now Mom is reaching her limit and Dad is still not able to break out of the plateau entered in the 1960s. With the current outlook for slow employment growth it could be that the breakout risk for Dad may be to the downside more than to the upside in the next few years.
Relief from the economic insecurity of the bottom 80% may not be coming soon. The expansion of distress to include 85% as suggested by the Associated Pressreport is a real possibility.
In econ_news, syndication / John Lounsbury
Hat tip to Dan Flemming.
Sources:
- Exclusive: 4 in 5 in US Face Near-Poverty, No Work (Hope Yen, Associated Press, 28 July 2013)
- Historical Income Tables: People (U.S. Census Bureau)
- Graph: Income Gini Ratio for Households by Race of Householder, All Races(Federal Reserve Bank of St. Louis)
- Gini coefficient (Wikipedia)
- Mothers Now Top Earners in 4 of 10 US Household (Hope Yen, Associated Press, 29 May 2013)
- Breadwinner Moms (Wendy Wang, Kim Parket and Paul Taylor, Pew Research, 29 May 2013)
- Household Income Depression (GEI News, 31 March 2013)
- Real Household Income (John Lounsbury, GEI Analysis, 11 October 2011)
- Private Investment: Between a Rock and a Hard Place (John Lounsbury, GEI Analysis, 05 October 2011)